Social results: growth per channel and what worked
The Social tab of Results shows how your audience grew, each network's own growth measure, and which posts worked best, with one post up close.
Before you start
- At least one connected social network with a few days of readings. Munshi reads each account about twice a day. Change over a window fills in once there are readings at both ends of it.
-
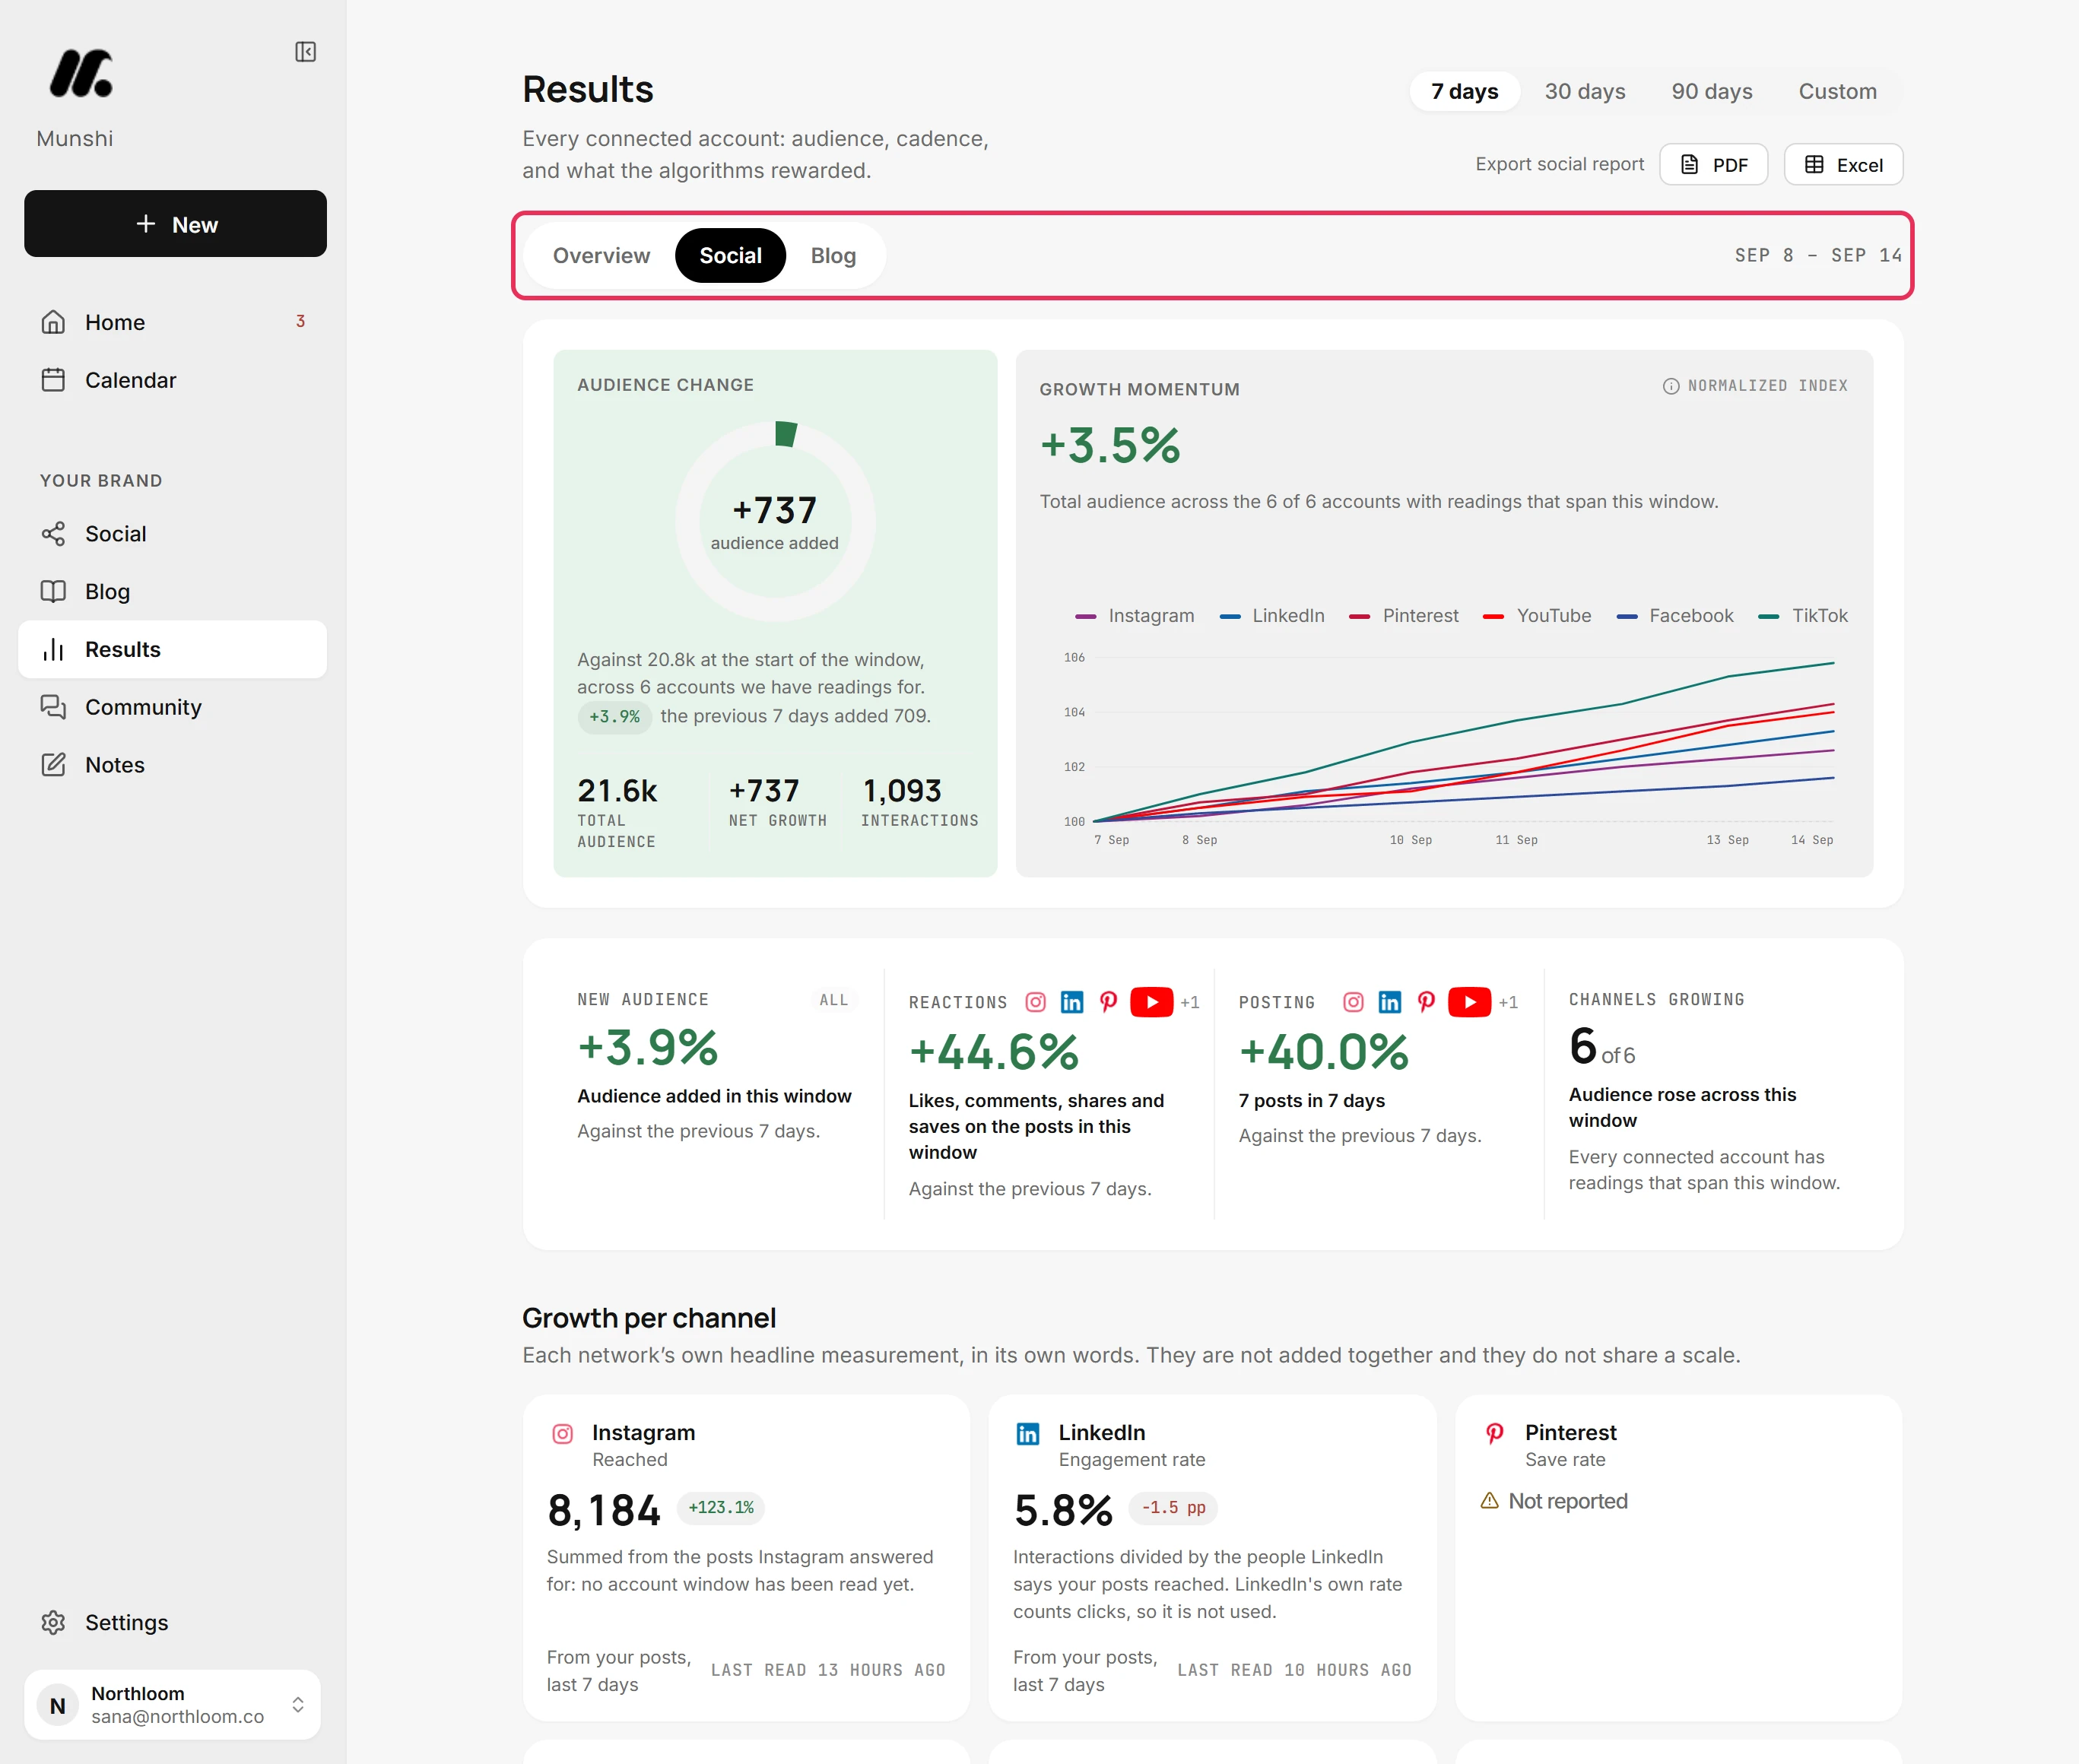
In Results, click Social. It reads every connected account over the window you pick. The choices are the same as on Overview: 7 days, 30 days, 90 days and Custom.
-
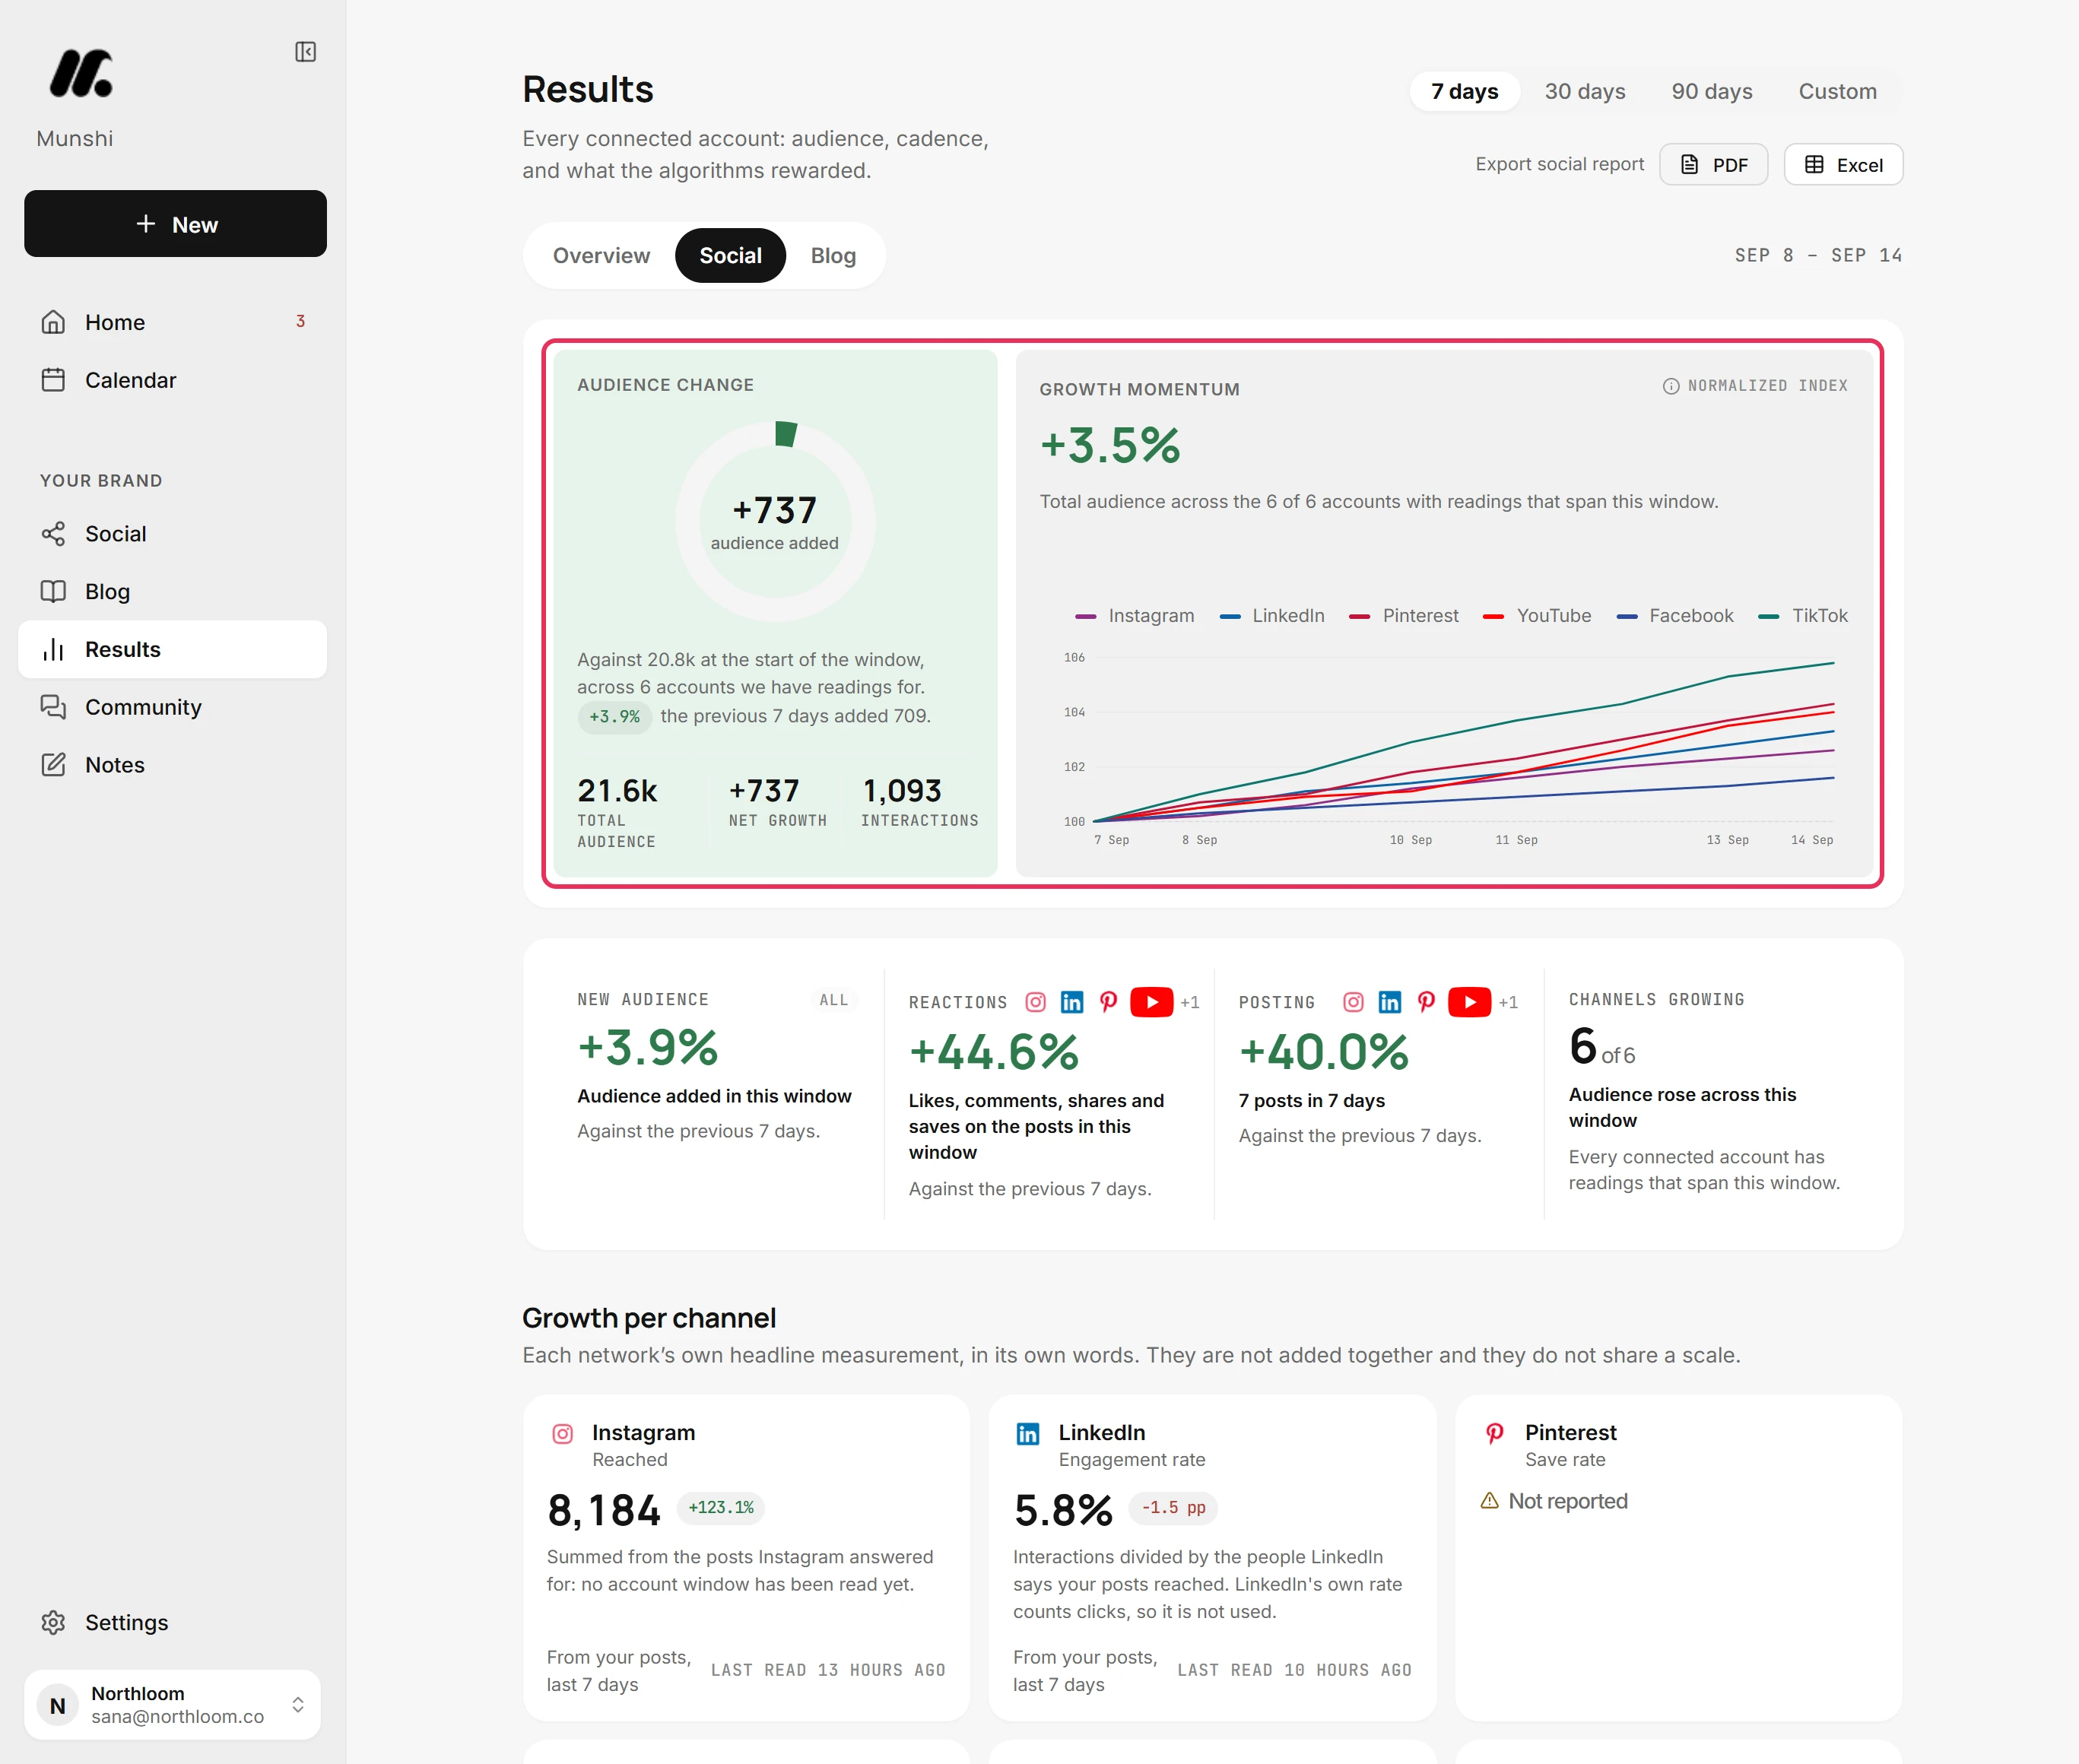
Audience change shows how much audience your accounts added over the window, against where they started. Under it are the total audience, net growth and interactions. Growth momentum starts every network at 100 on one chart. This lets you compare direction, not size.
-
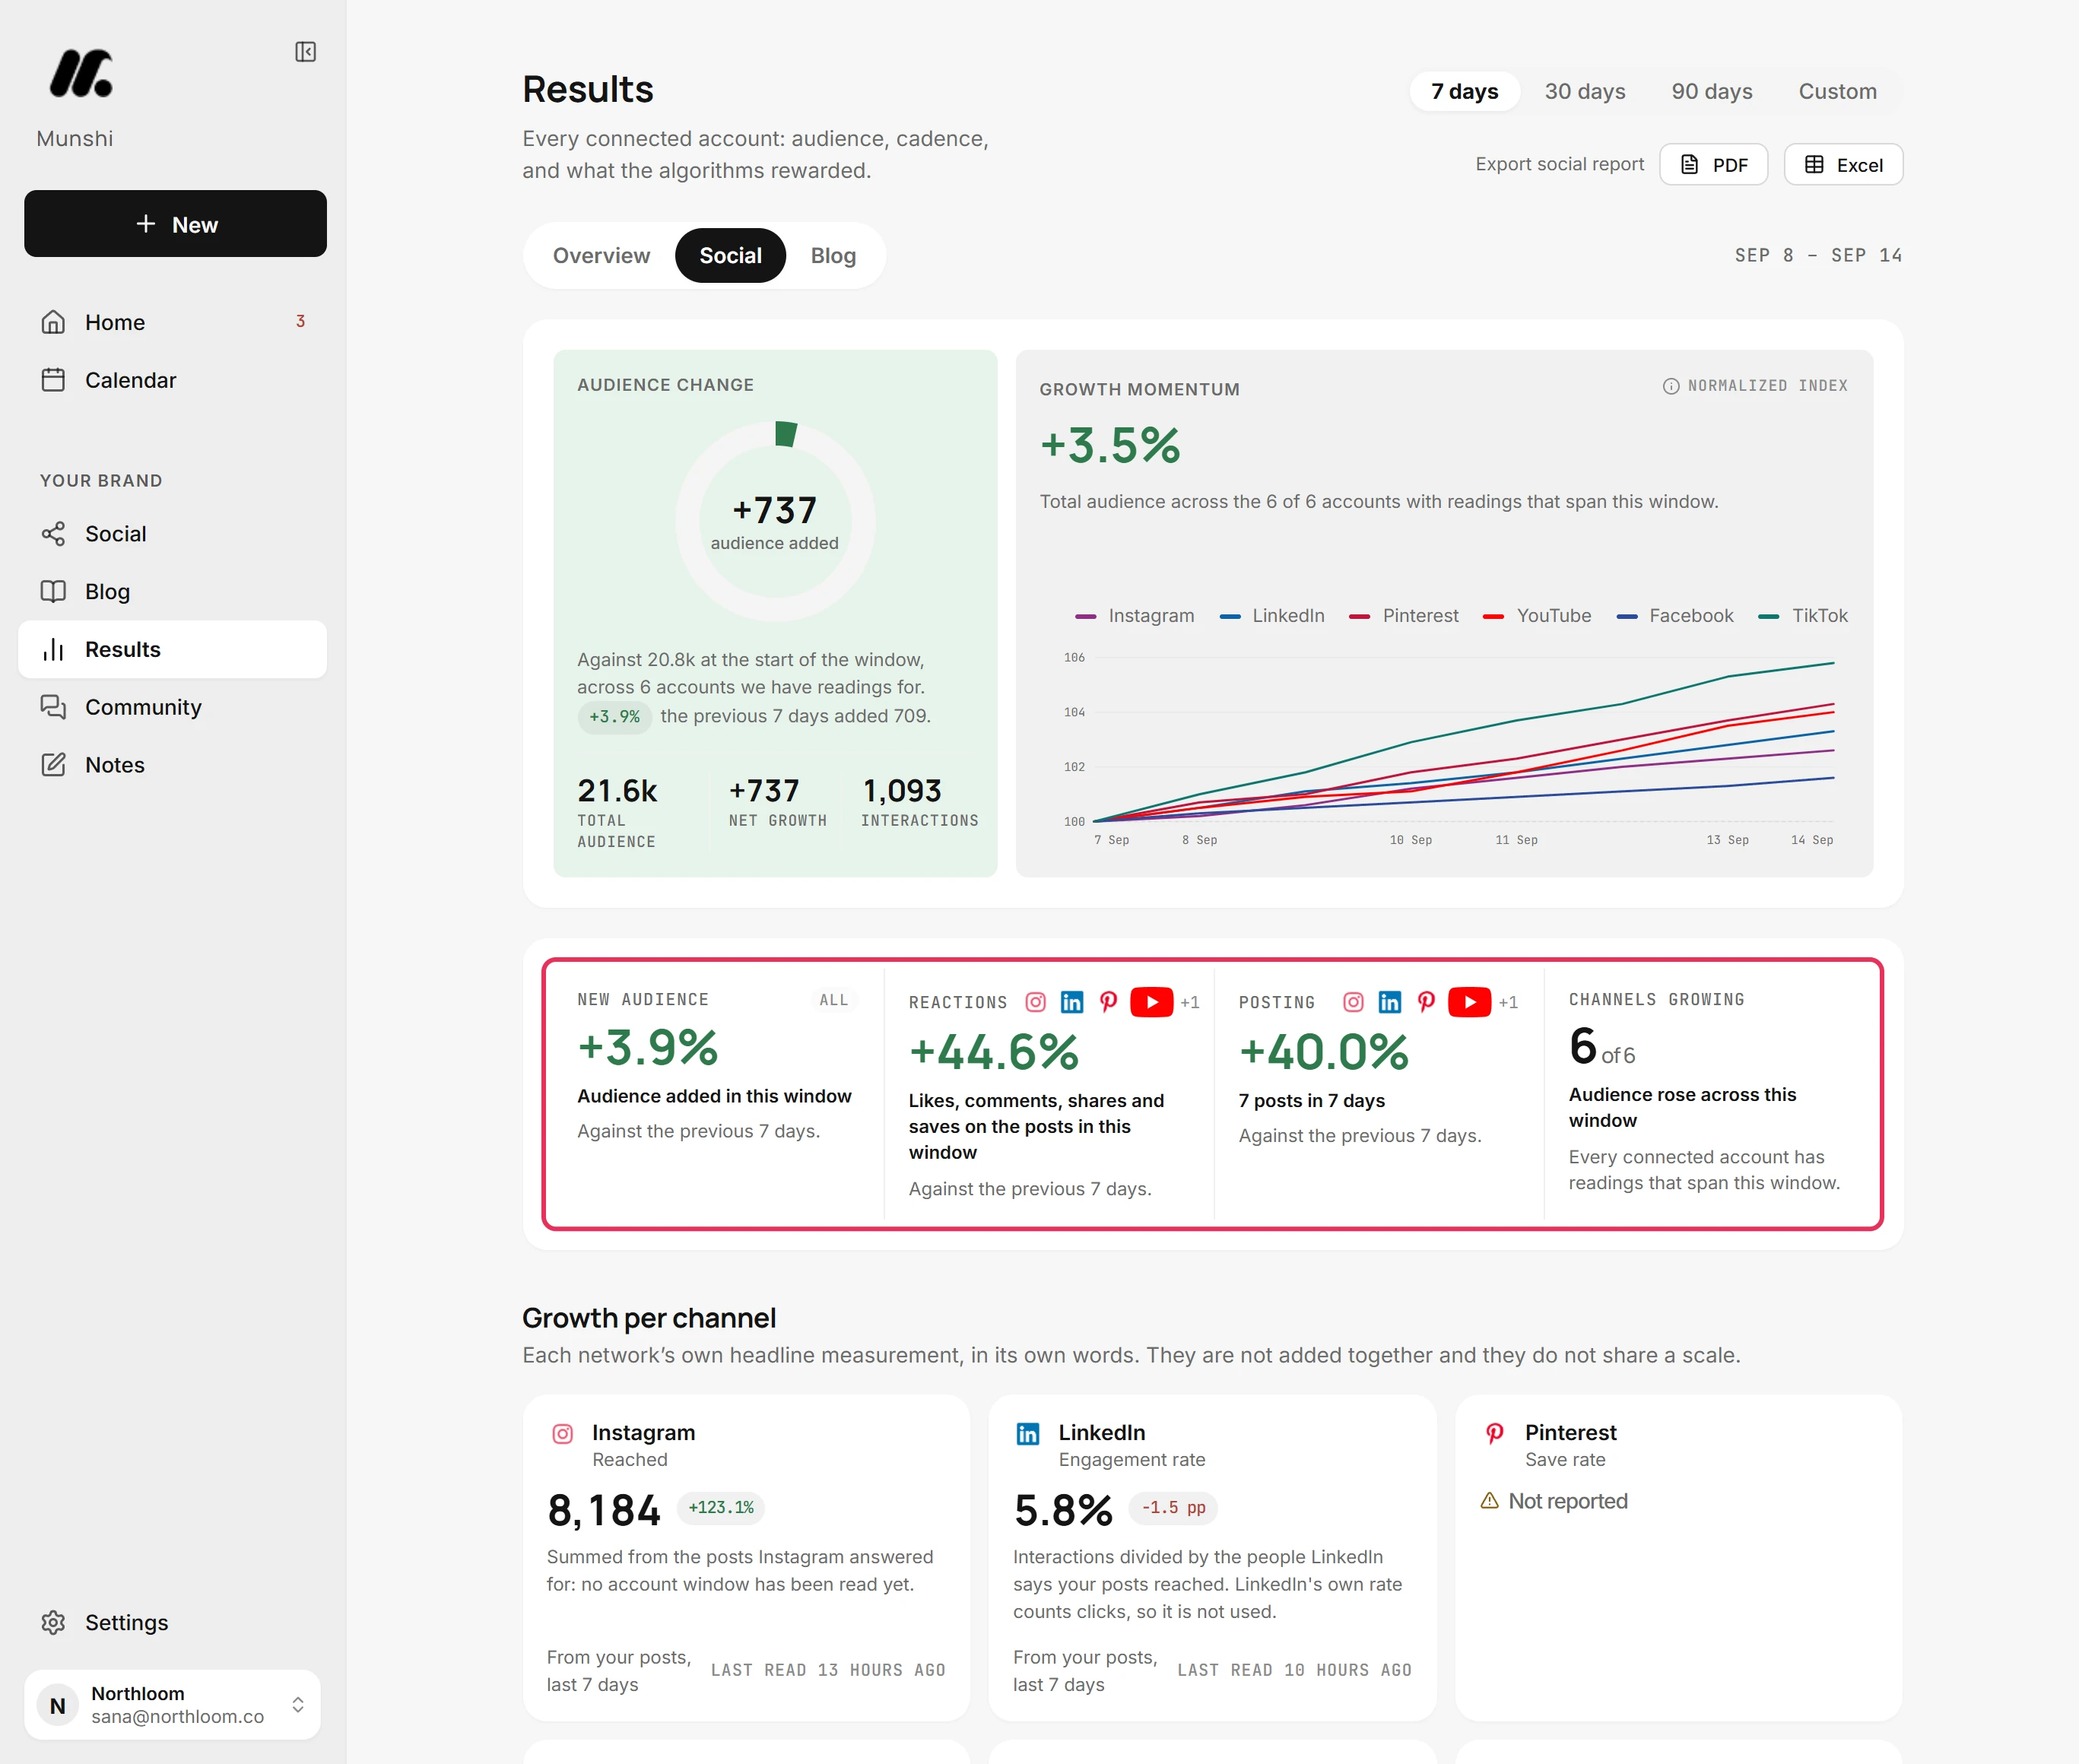
New audience is the audience added in the window. Reactions counts the likes, comments, shares and saves on its posts. Posting counts how many posts went out. Channels growing counts how many accounts gained audience. Each says what it is compared with, or why it cannot be.
-
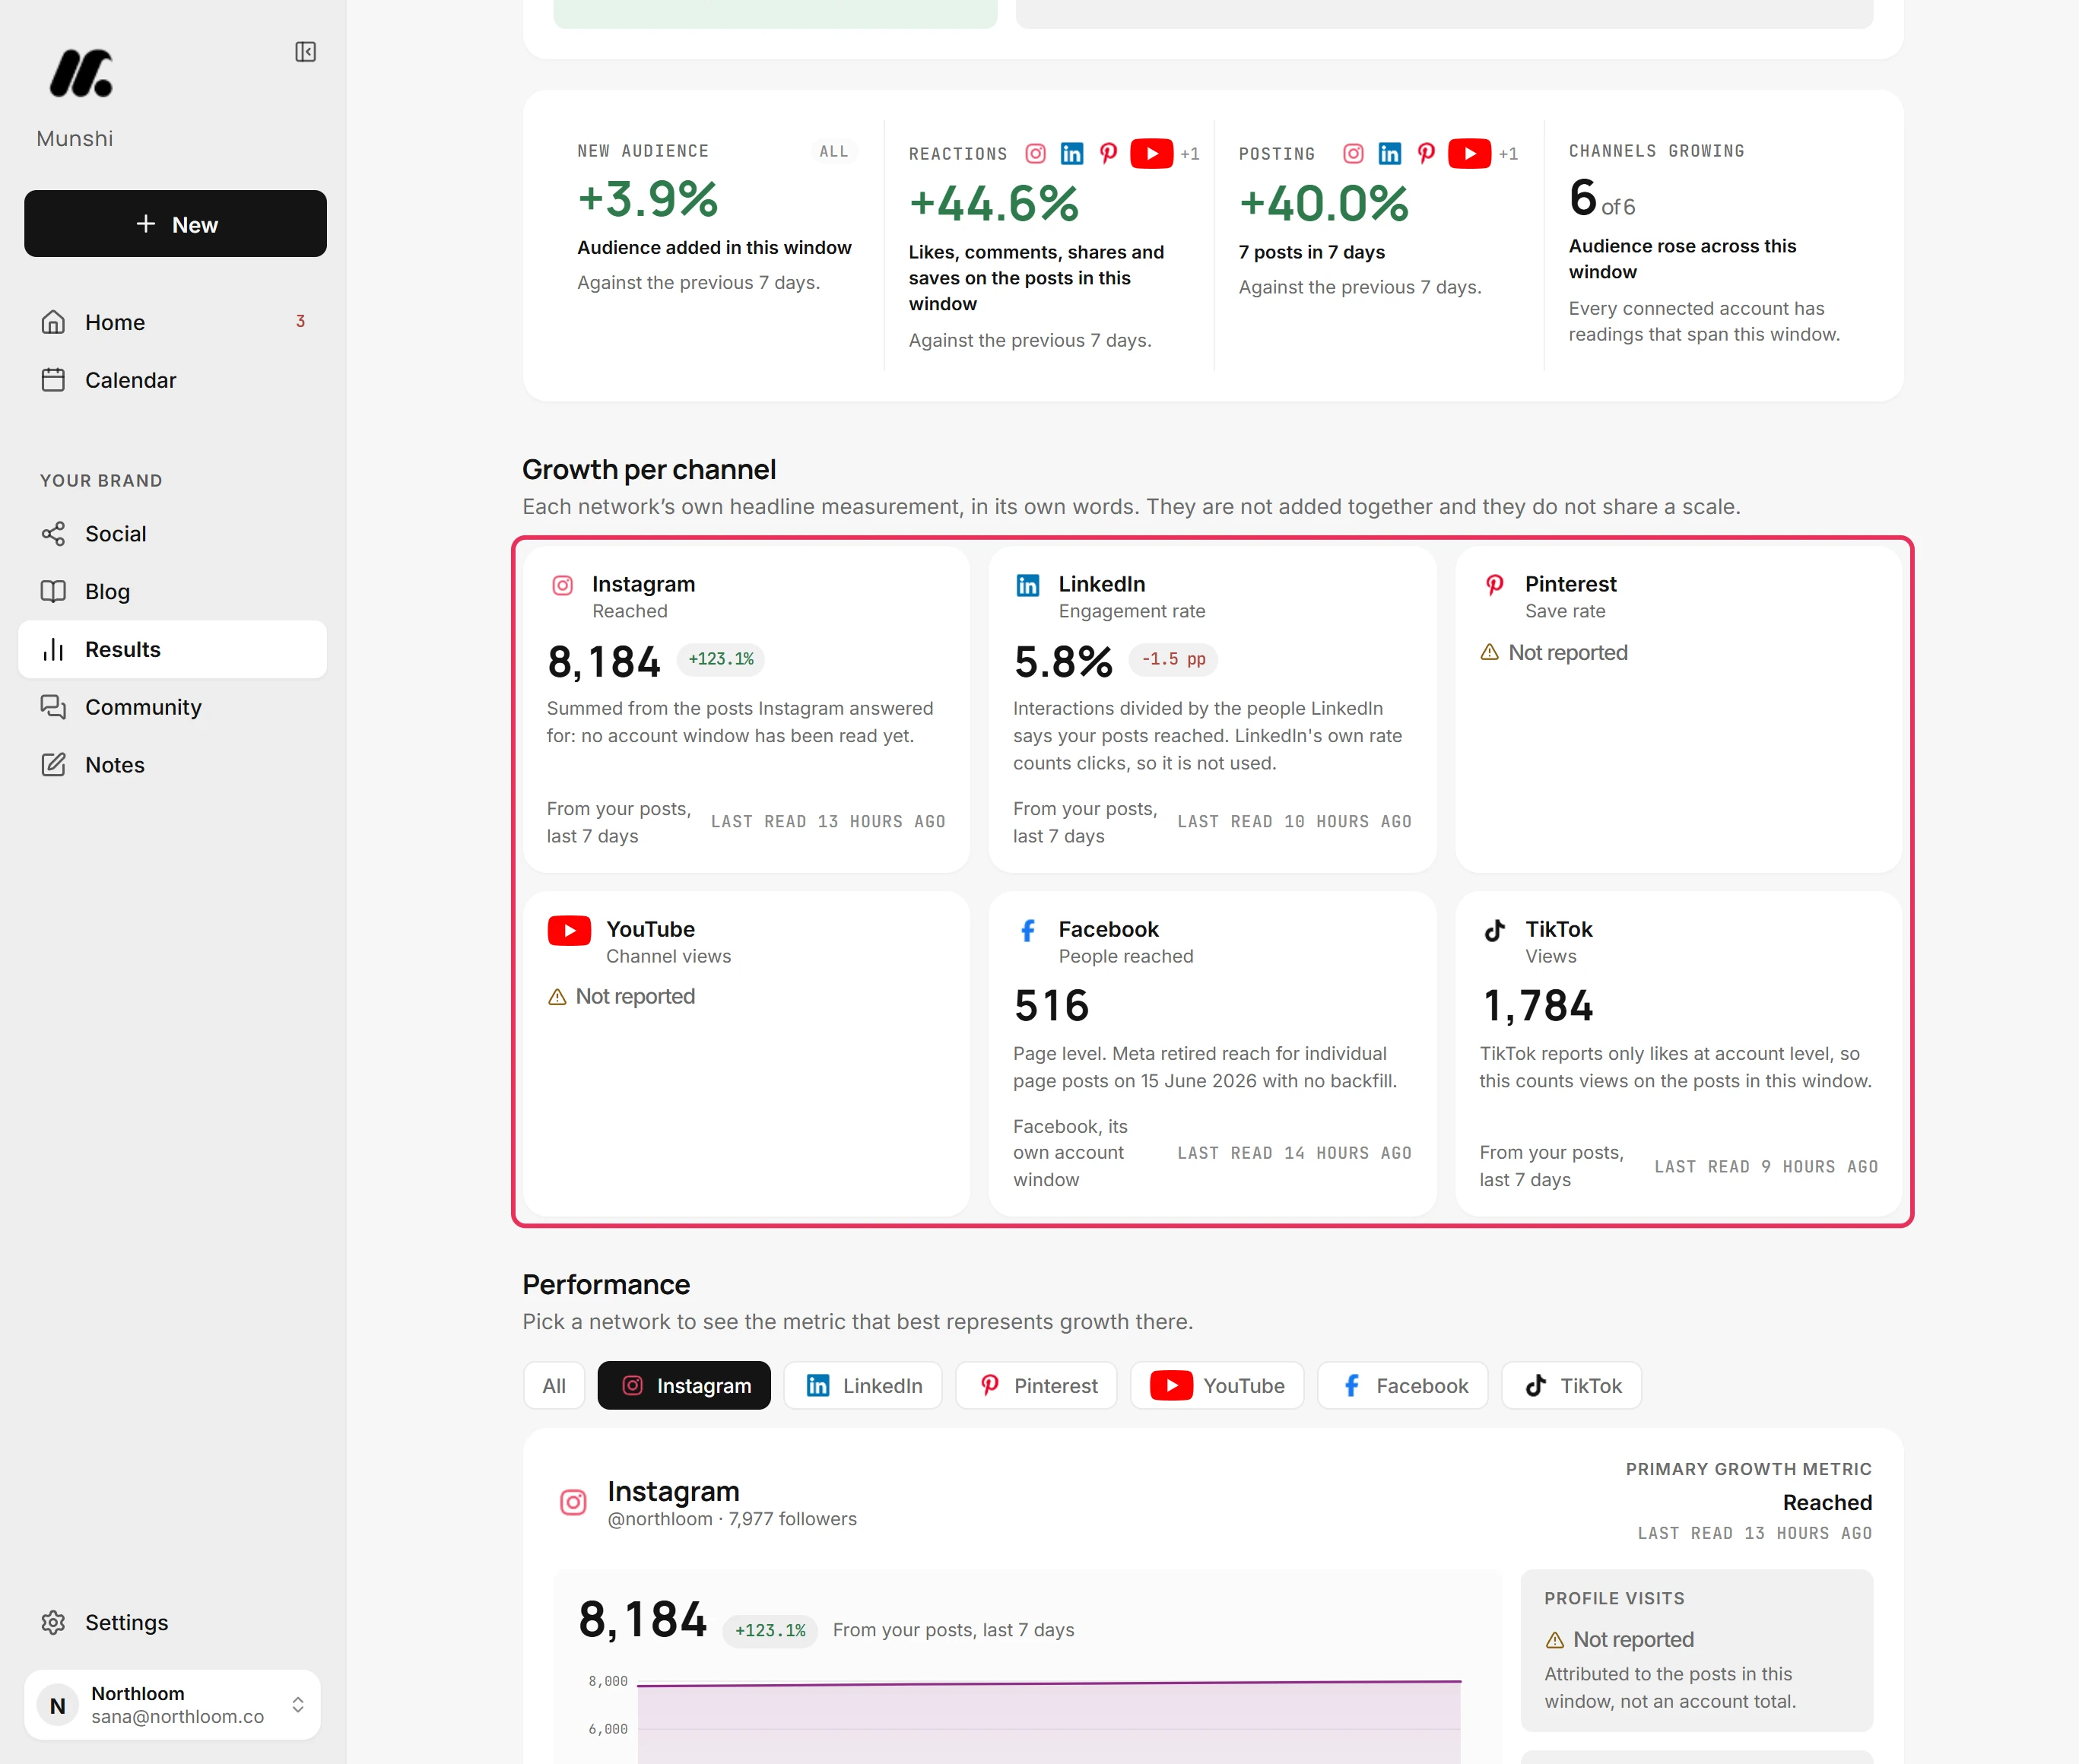
Growth per channel gives each network its own headline measure. Examples are reach on Instagram, engagement rate on LinkedIn and views on TikTok. They are never added together. Each card says where its number comes from and when it was last read.
-
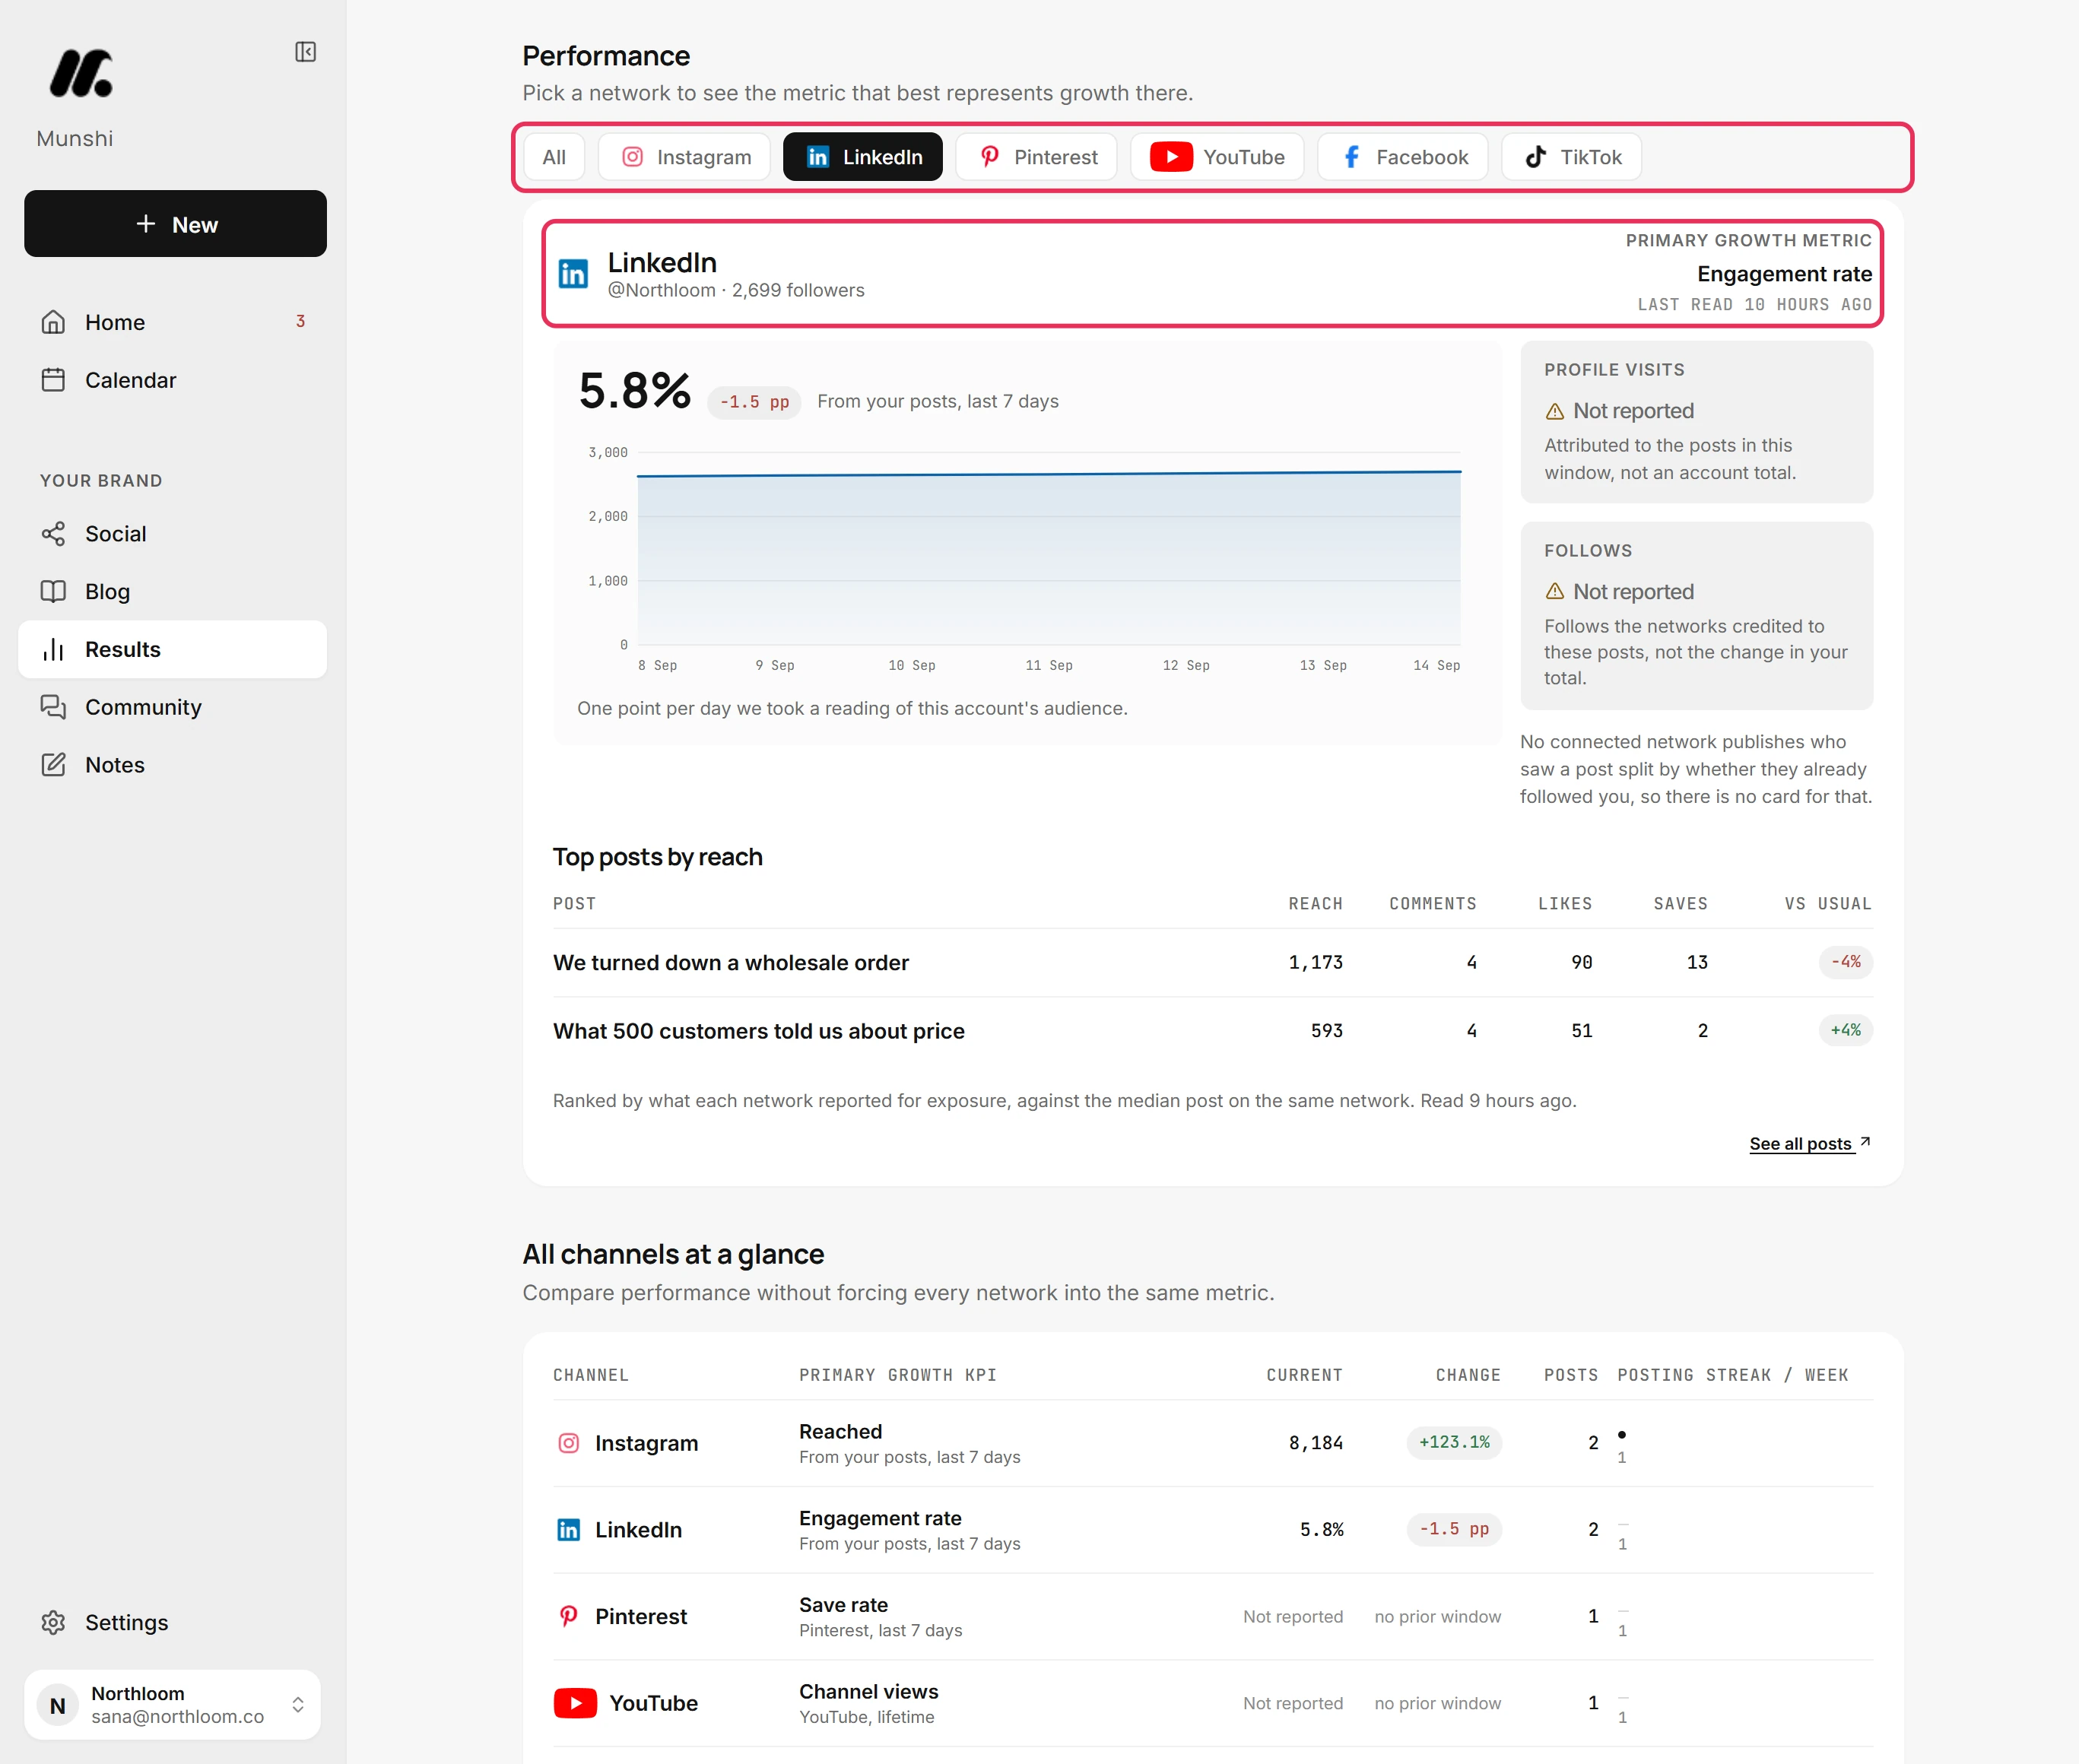
Under Performance, click a network. Its main growth measure is charted over the window, next to Profile visits and Follows. Its top posts are underneath. All shows every account without a chart, because their measures differ.
-
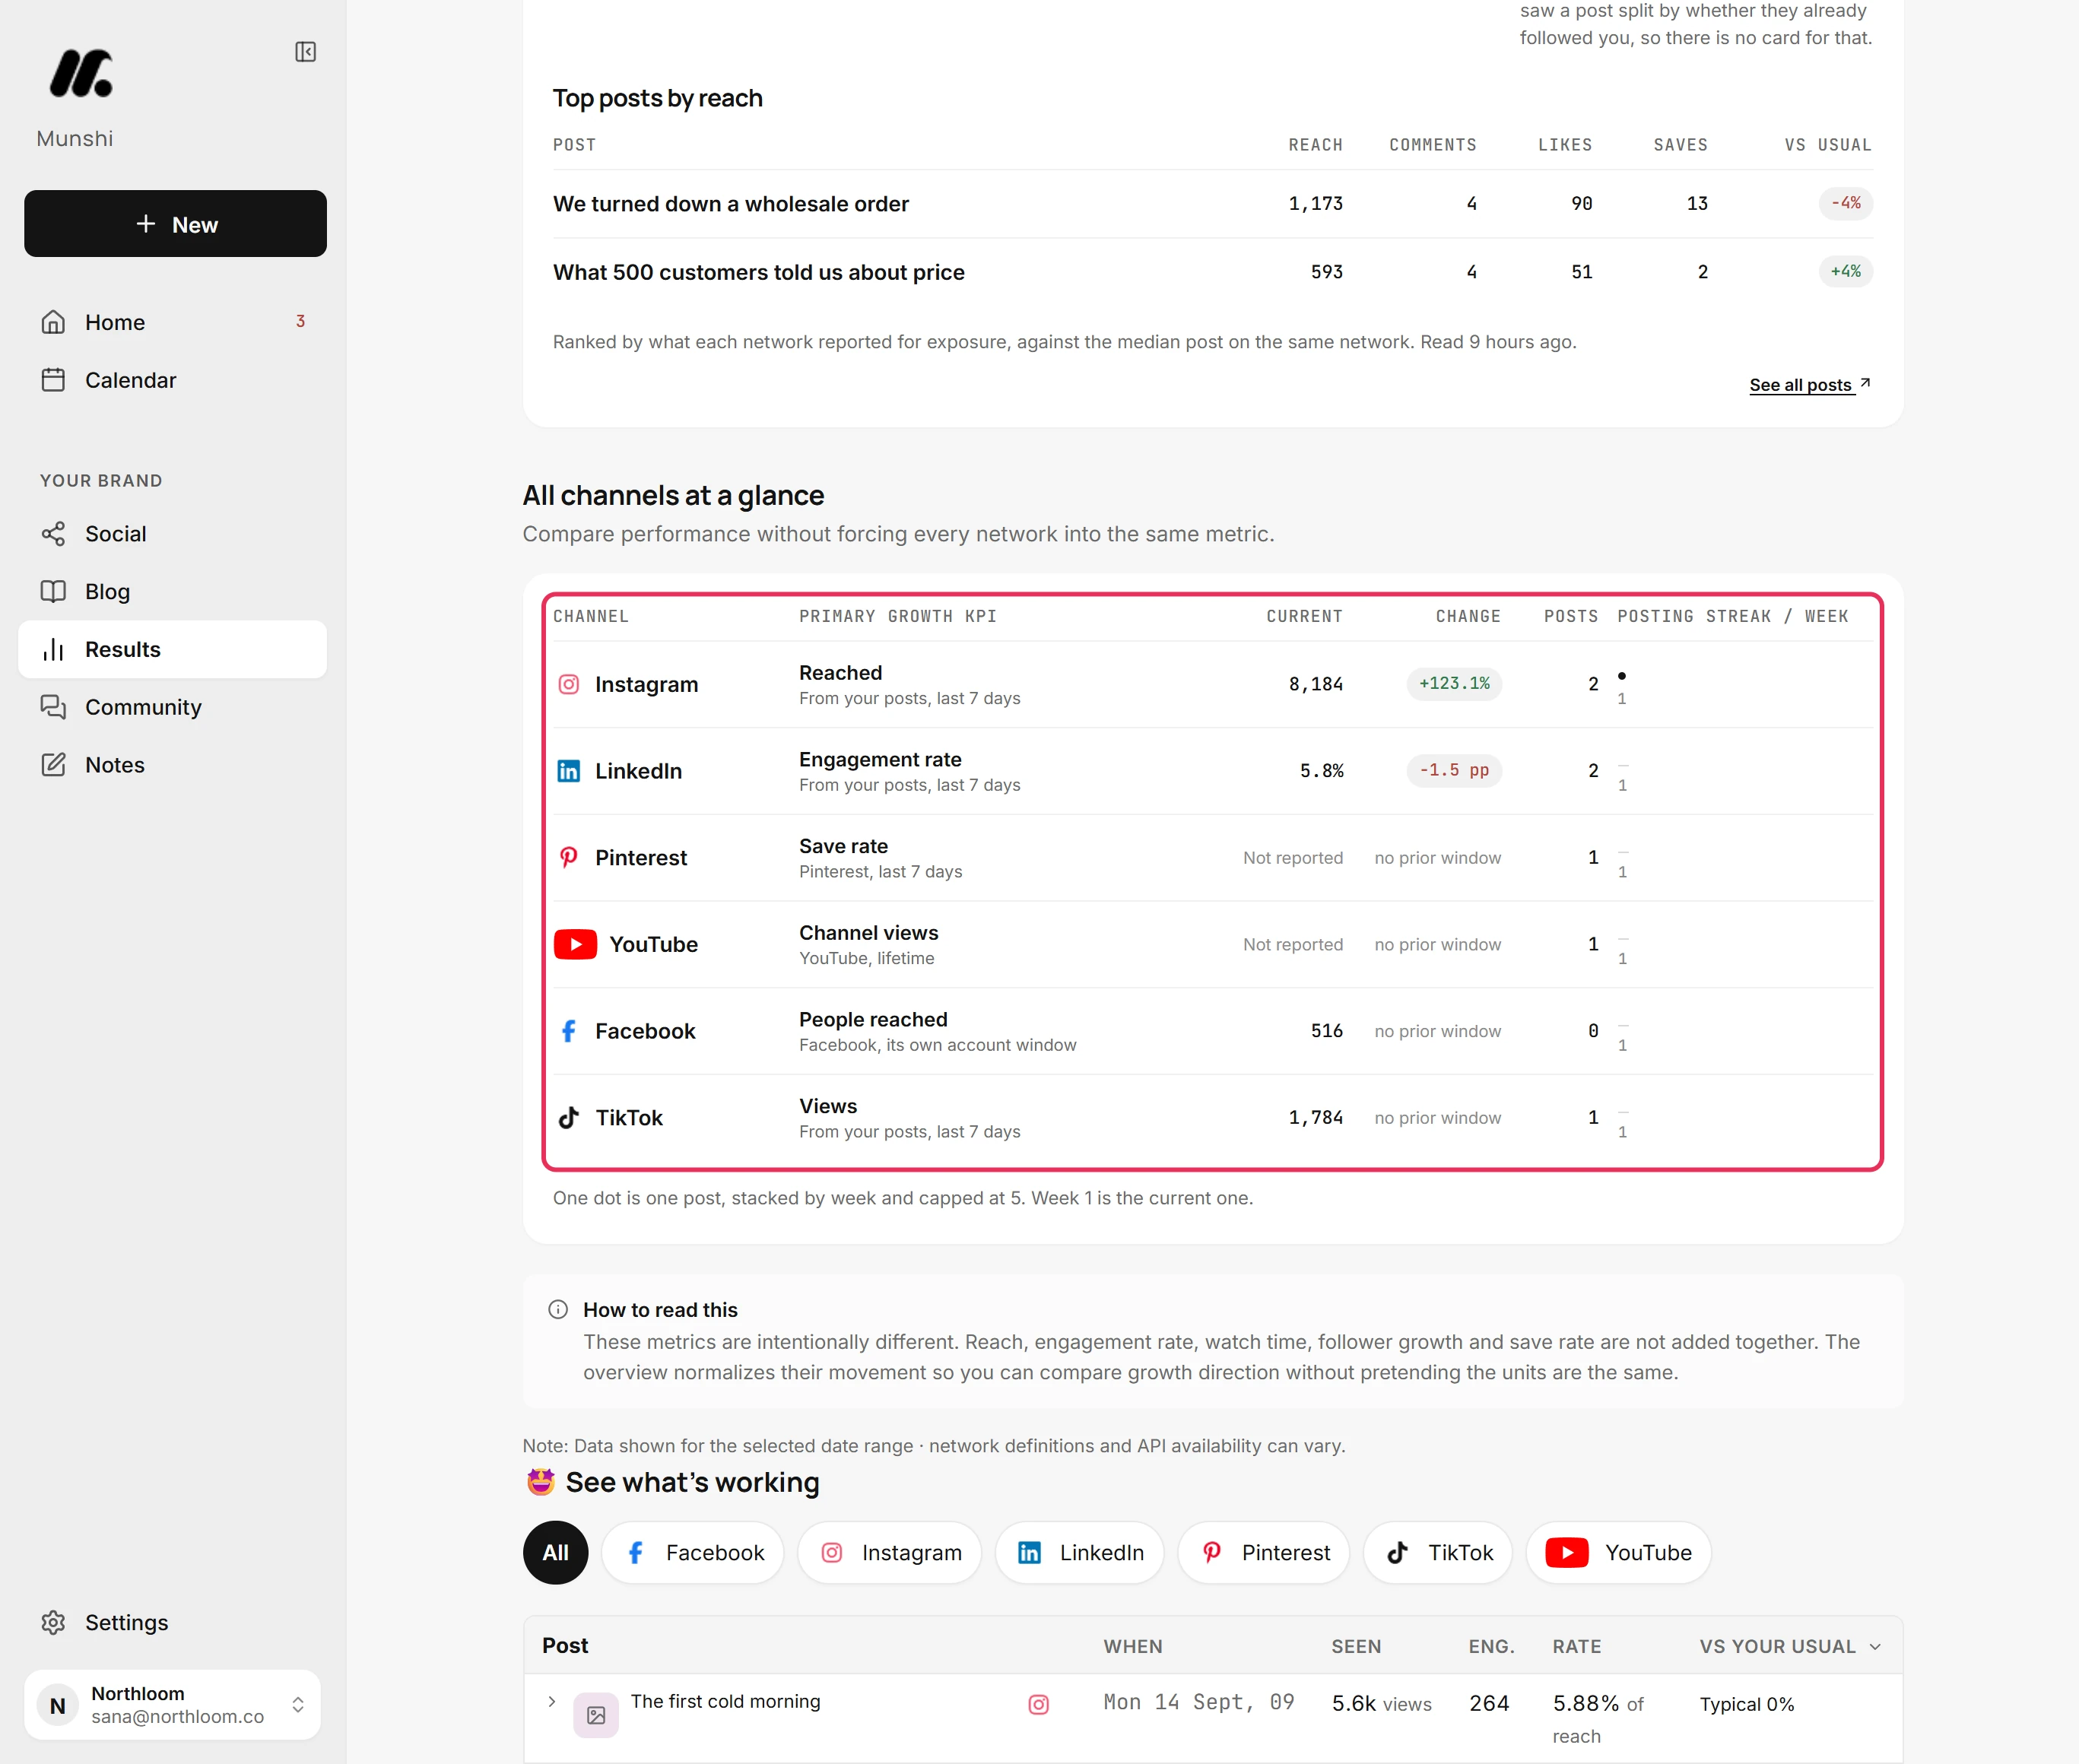
All channels at a glance lines the networks up in one table. Each row shows the main growth measure, its current value and change, and the posts in the window. It also shows a posting streak, with one dot per post for each week.
-
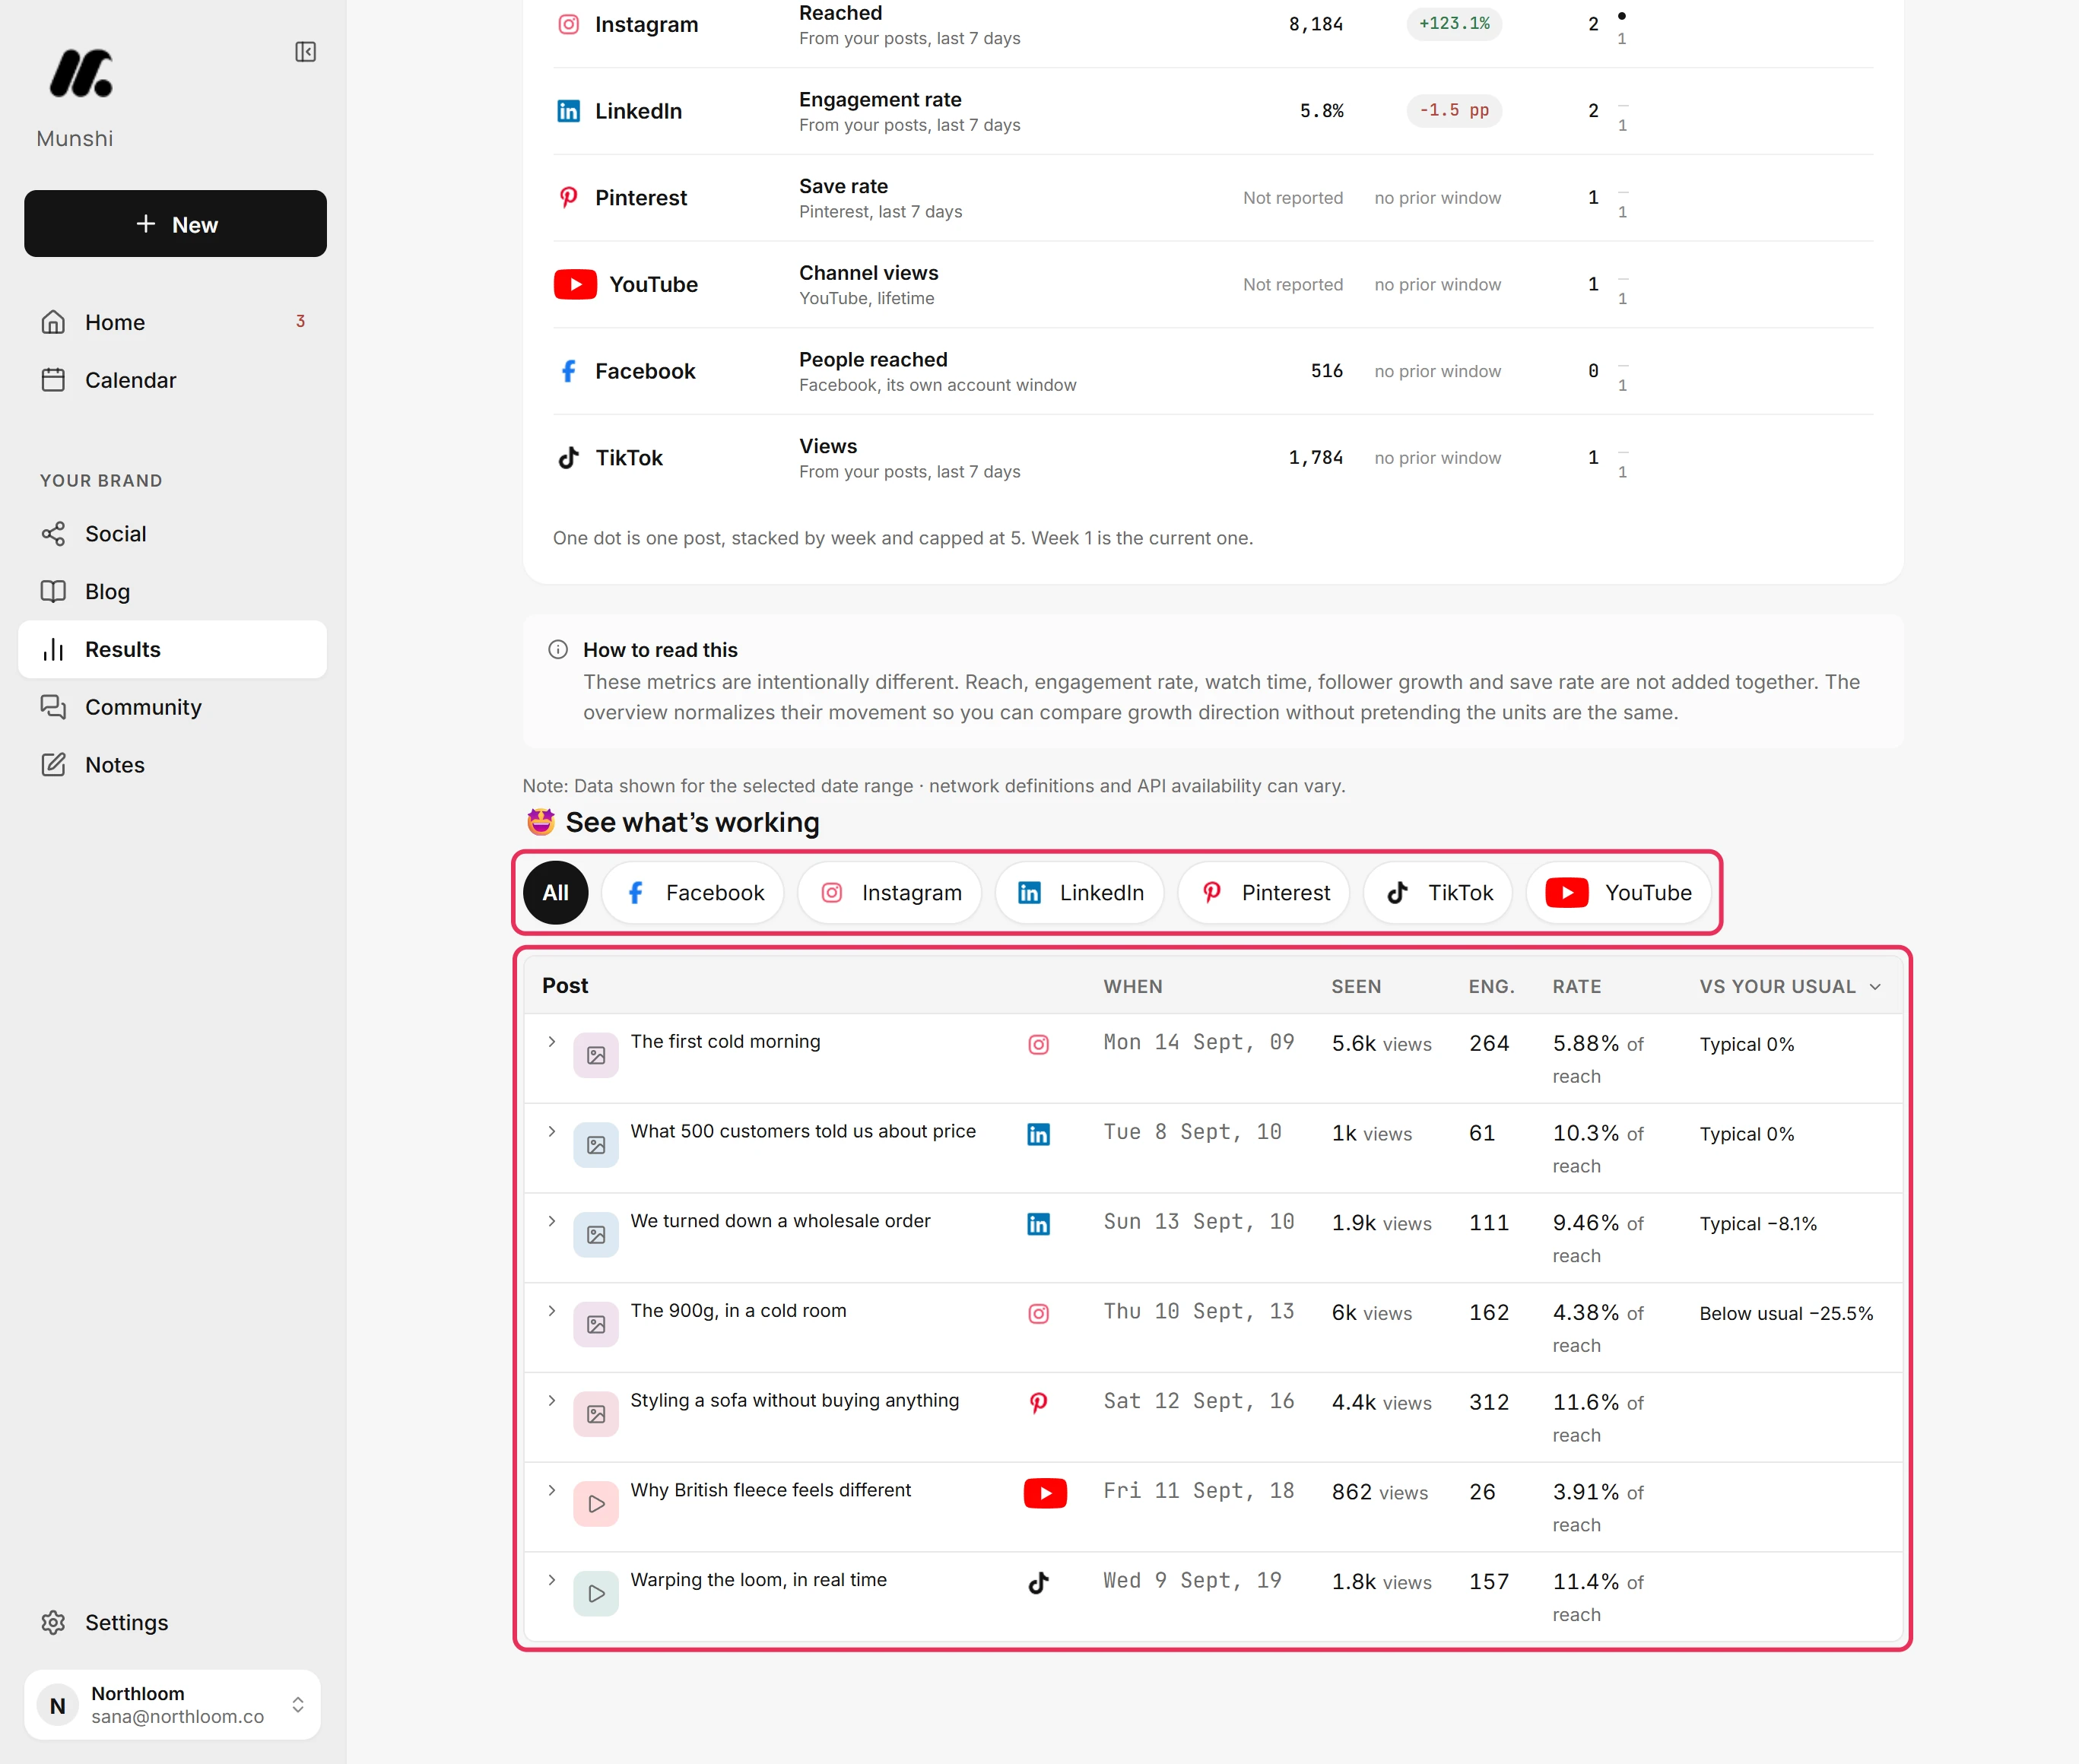
See what’s working lists the posts from the window. Each row shows how many saw the post, its interactions, its rate and how it did against your usual on that network. Filter by network with the buttons above the table. Click a column heading to sort.
-
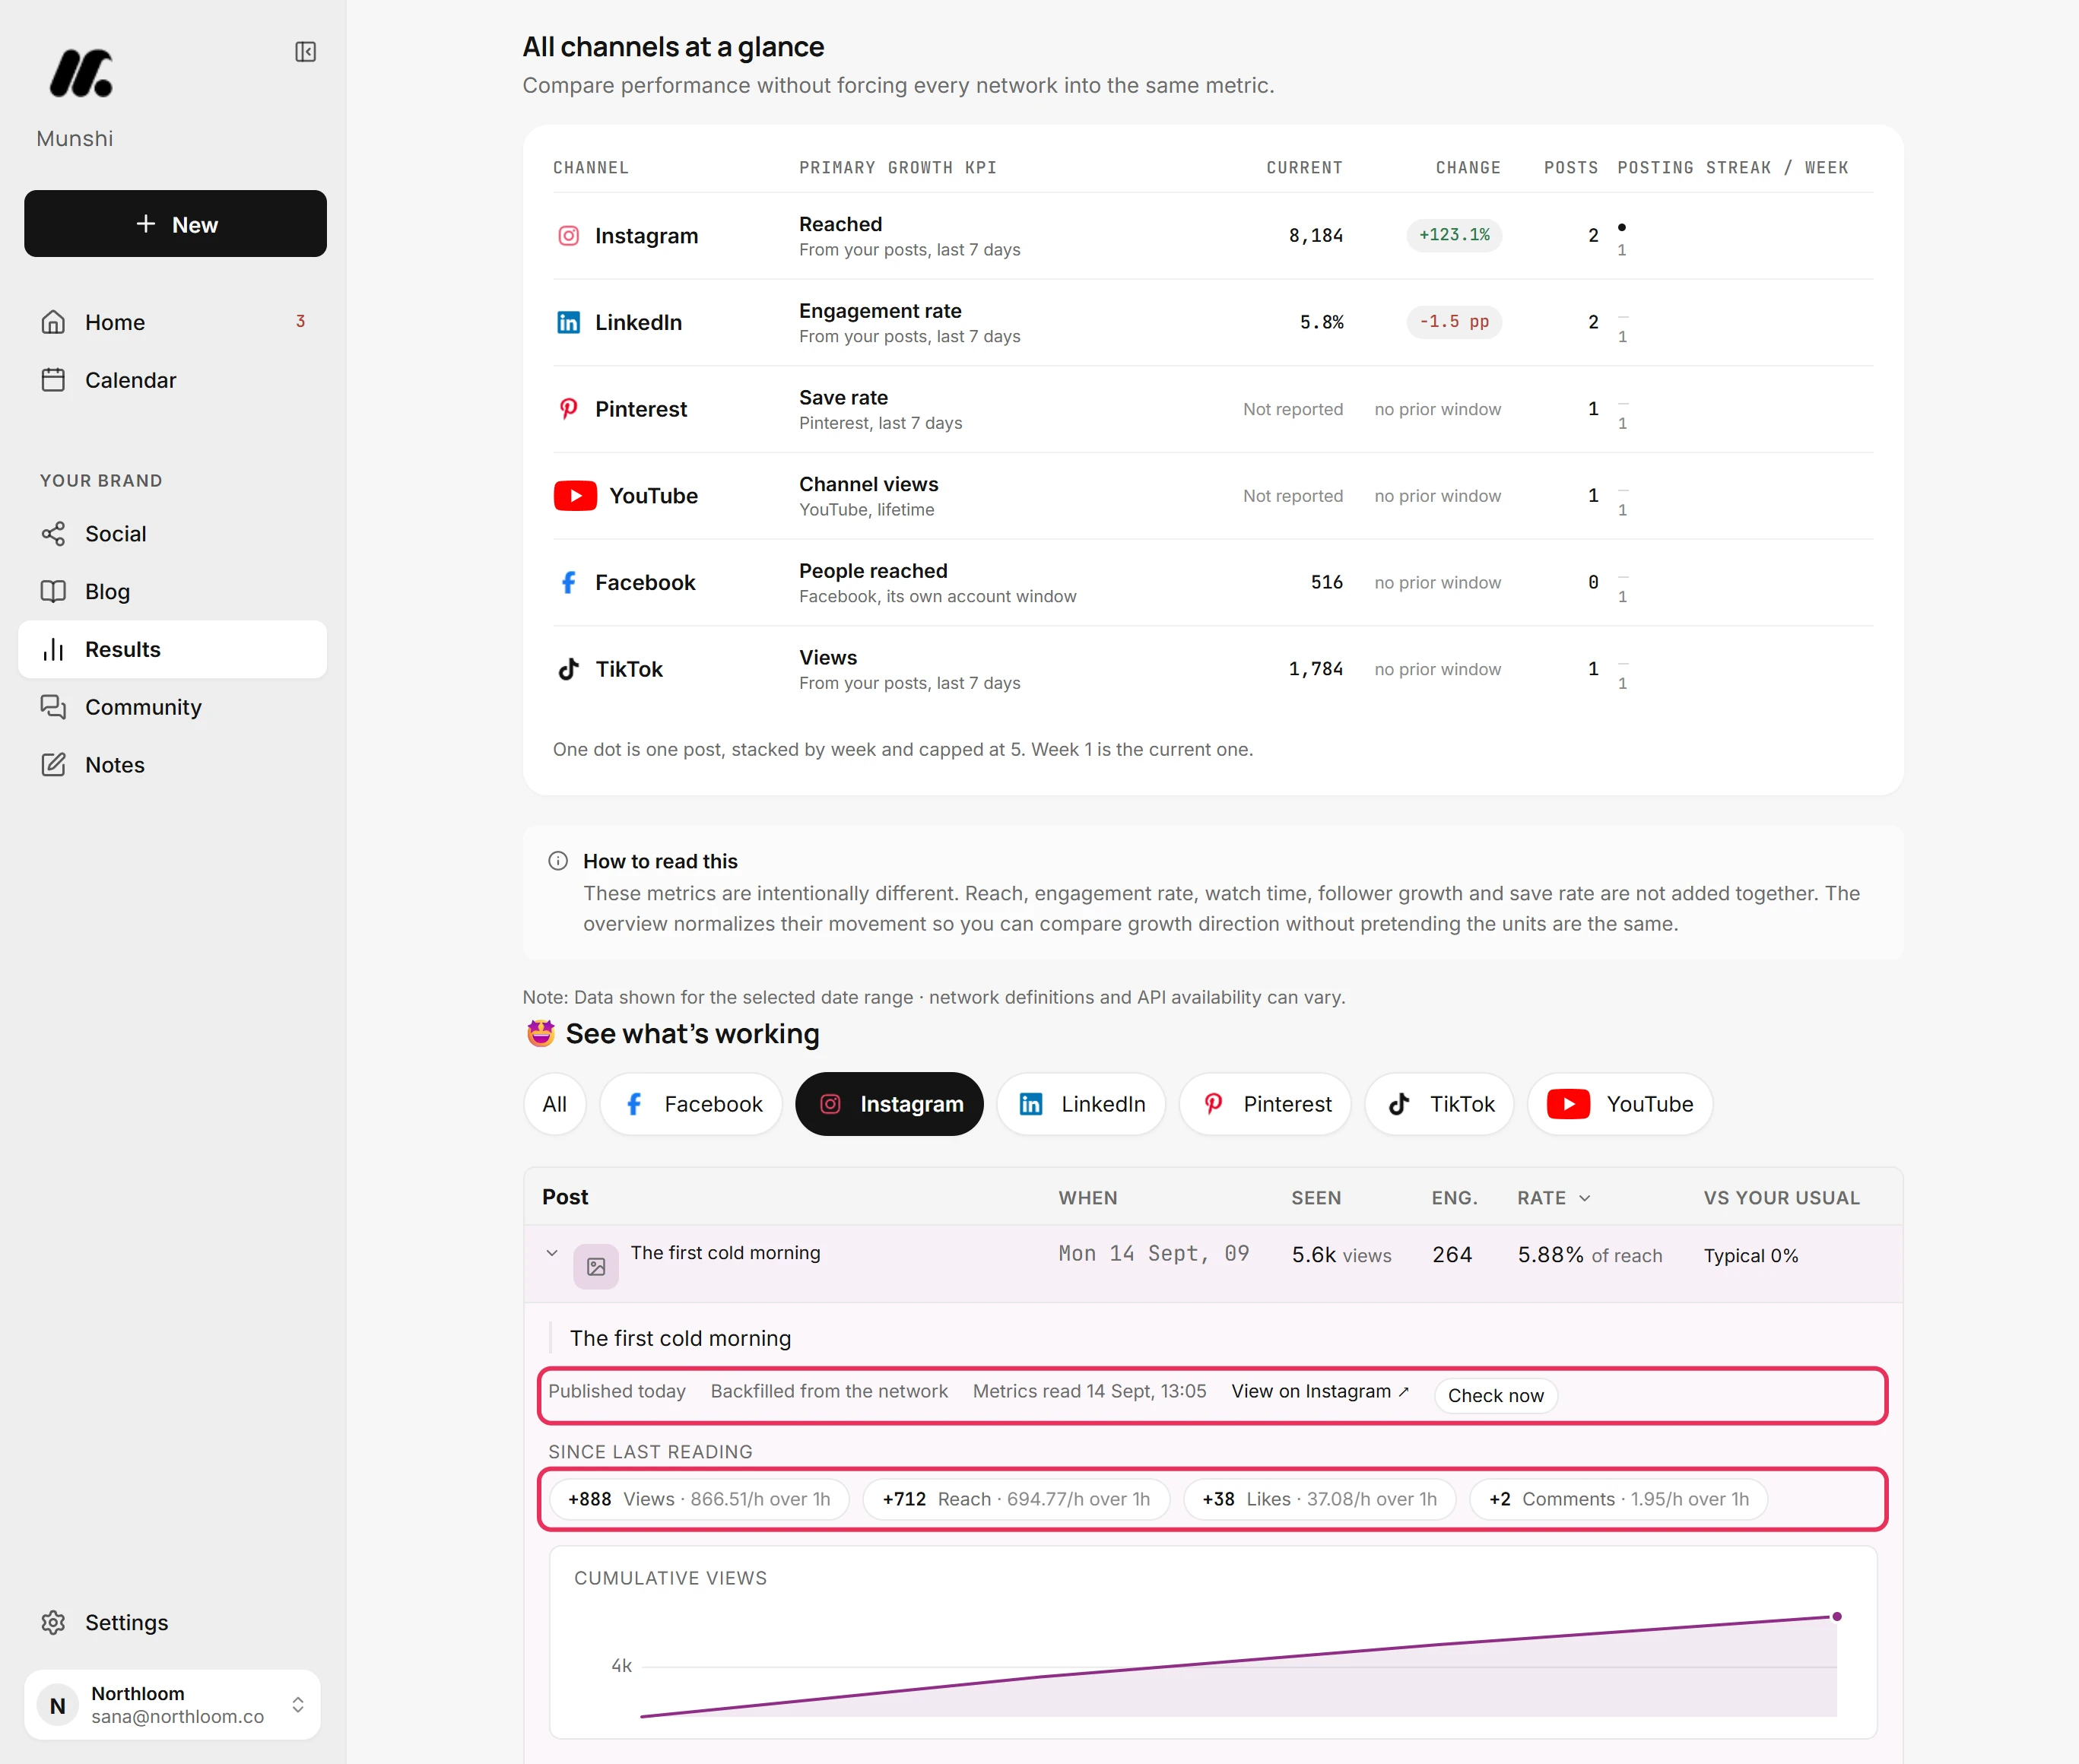
Click a post to open it. It shows how old the post is and when its numbers were last read. It also has a link to the post on the network, what changed since the last reading and its running total. Check now asks the network for fresh numbers for that one post.
Where you are now
You can tell which networks are growing and what each one counts as growth. You can also see which posts earned their place. To take the numbers away, export the social report.
If something goes wrong
“Not recorded long enough”
Wait, or pick a shorter window, which fills in sooner. Audience change needs a reading at the start of the window and one at the end. Munshi reads each account about twice a day, so it fills in on its own.
“No numbers yet” beside a post
Check back in a few hours. The network has not sent readings for that post yet. First numbers appear a few hours after publishing.
“Unavailable” beside a post
Check whether the post still exists on the network. Munshi asked the network several times and got no reading back. That usually means the post was removed.
“That's a lot of refreshes. Try again in a few minutes.”
Wait a few minutes and try again. Check now was pressed many times in a short while. The numbers already on screen stay as they are.
Try it on your own brand this week.
Munshi Social, the AI content marketing engine for small teams, plans, writes, publishes, and tracks your blog and socials. The guide above shows the real app, not a mock-up.
Start your workspace